
A visitor lands on your site. One second passes. Two seconds. Three seconds — and 53% of mobile visitors are already gone. They didn’t read your headline, check your prices, or see your portfolio. They just left, because your site was slow. Here’s the good news: diagnosing speed problems costs $0. Free website speed test tools can pinpoint exactly what’s slowing you down, and most fixes don’t cost anything either. You don’t need a $99/month performance monitoring subscription — you need 20 minutes and the right free tools.
Speed isn’t just a user experience issue anymore. Since 2021, Google has used Core Web Vitals as a ranking factor. Slow sites rank lower, period. Furthermore, every 100ms of load time improvement can increase conversions by up to 8%. That means speed optimization is both an SEO strategy and a revenue strategy — and you can do it entirely for free. Let me show you how.
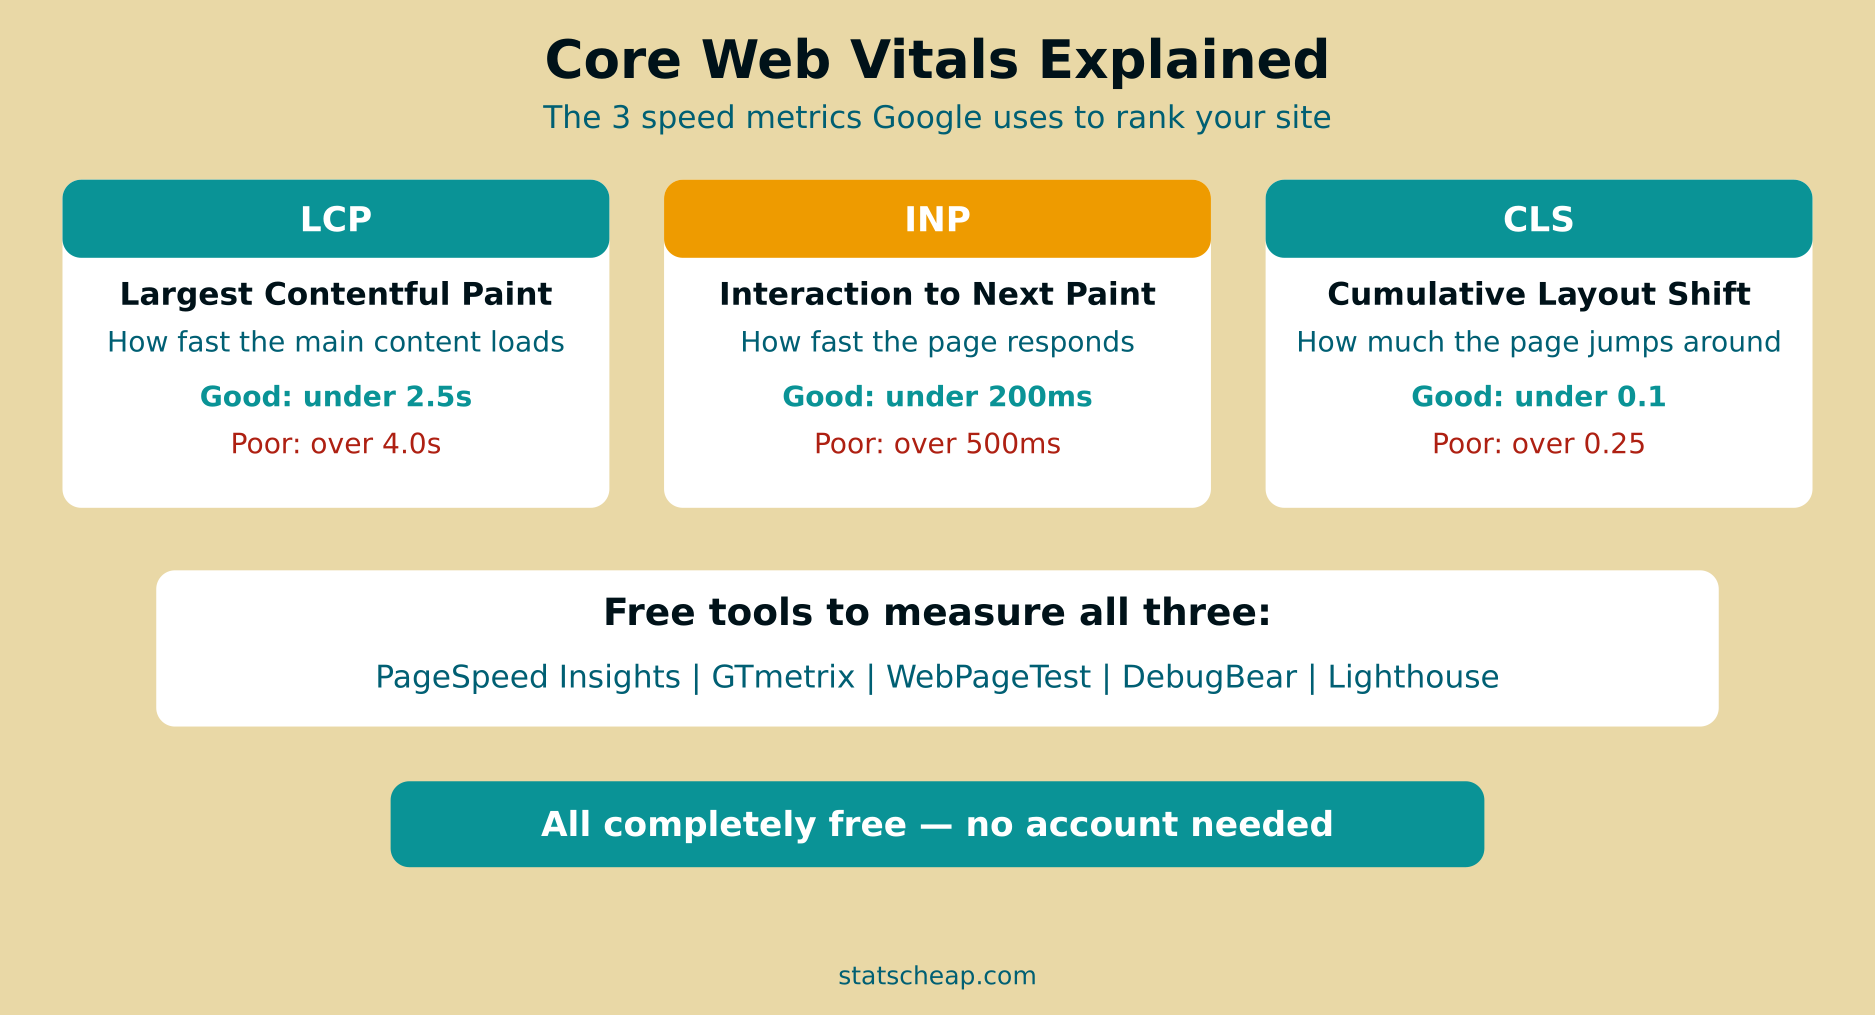
Core Web Vitals: The Three Metrics That Matter
Before diving into tools, you need to understand what they measure. Google’s Core Web Vitals are three specific metrics that define a “fast” website. Every free website speed test tool reports these, so knowing what they mean helps you prioritize fixes.
LCP — Largest Contentful Paint (Target: Under 2.5 Seconds)
LCP measures how long it takes for the biggest visible element on your page to load. This is usually a hero image, a video thumbnail, or a large text block. If your LCP is over 2.5 seconds, your page feels slow even if smaller elements load quickly. Common causes of slow LCP include unoptimized images, slow server response times, and render-blocking CSS or JavaScript. Therefore, fixing LCP usually means compressing your hero image and cleaning up your CSS delivery.
INP — Interaction to Next Paint (Target: Under 200ms)
INP replaced First Input Delay (FID) in March 2024. It measures how quickly your site responds when someone clicks a button, taps a link, or interacts with a form. If INP exceeds 200ms, interactions feel laggy and unresponsive. The most common cause is heavy JavaScript that blocks the main thread. Consequently, reducing JavaScript bundle size and deferring non-critical scripts are the primary fixes.
CLS — Cumulative Layout Shift (Target: Under 0.1)
CLS measures visual stability — how much content shifts around as the page loads. You’ve experienced this: you’re about to click a link, and suddenly an ad loads above it, pushing the link down so you click the wrong thing. That’s layout shift. Common causes include images without explicit width/height attributes, dynamically injected content, and web fonts that swap after loading. CLS is often the easiest metric to fix — just add width and height to your images and reserve space for ads.

5 Free Website Speed Test Tools Compared
Each of these tools is completely free and offers different strengths. I recommend using at least two for a complete picture, since each tool measures from different locations and emphasizes different aspects.
1. Google PageSpeed Insights — The Official Standard
Cost: Free (unlimited tests)
Best for: Core Web Vitals scores, mobile vs desktop comparison
URL: pagespeed.web.dev
PageSpeed Insights is Google’s own speed test tool, and it’s the most authoritative source for Core Web Vitals data. It runs a Lighthouse audit and shows both lab data (simulated) and field data (real user measurements from Chrome users). The field data section is gold — it tells you how actual visitors experience your site, not just how fast it loads in a simulated environment. Furthermore, it provides specific, prioritized recommendations for improvement with estimated time savings.
Use PageSpeed Insights as your primary tool because Google uses this data for search rankings. If your score is green here, you’re in good shape for SEO.
2. GTmetrix — The Best Waterfall Charts
Cost: Free (limited tests per day)
Best for: Waterfall charts, request analysis, historical tracking
URL: gtmetrix.com
GTmetrix produces the most readable waterfall charts of any free tool. A waterfall chart shows every file your page loads, in order, with timing for each. This makes it obvious which resources are blocking rendering, which files are too large, and where bottlenecks occur. Additionally, the free account lets you save test history, so you can track improvements over time. The visual layout makes it easy to spot problems even if you’re not technically inclined.
3. WebPageTest — The Most Detailed Analysis
Cost: Free (unlimited tests)
Best for: Multi-step tests, connection throttling, 80+ global locations
URL: webpagetest.org
WebPageTest is the tool performance engineers use. It offers testing from over 80 global locations, simulated connection speeds (3G, 4G, cable), and filmstrip views showing exactly what your visitor sees at each moment of loading. Furthermore, it runs repeat-view tests to show performance with browser caching active. The level of detail is unmatched — but it can be overwhelming for beginners. Use WebPageTest when PageSpeed Insights and GTmetrix identify a problem but don’t give you enough detail to fix it.
4. DebugBear — Automated Issue Detection
Cost: Free (limited features)
Best for: Identifying 25+ common performance issues, clear explanations
DebugBear’s free tool automatically detects over 25 common performance issues and explains each one in plain language. It’s particularly good at identifying render-blocking resources, oversized images, and unused CSS/JavaScript. Consequently, it’s the best starting point for non-developers who want to know what to fix without reading technical documentation. Each issue includes a clear explanation of why it matters and how to fix it.
5. Pingdom Tools — The Simplest Speed Test
Cost: Free (unlimited tests from 7 locations)
Best for: Quick speed checks, load time benchmarking, simple reports
Pingdom Tools gives you a page load time, performance grade, and a list of recommendations in the simplest format possible. No complex charts, no technical jargon — just a clear speed score and actionable suggestions. It’s the tool I recommend for business owners who want a quick answer to “is my site fast enough?” without diving into technical details. However, for deeper analysis, you’ll need one of the tools above.
| Tool | Core Web Vitals | Waterfall Chart | Global Locations | Historical Data | Best For |
|---|---|---|---|---|---|
| PageSpeed Insights | Yes (lab + field) | Basic | 1 (simulated) | Field data only | SEO scores |
| GTmetrix | Yes | Excellent | 7 (free) | Yes (free account) | Visual analysis |
| WebPageTest | Yes | Detailed | 80+ | No | Deep technical |
| DebugBear | Yes | Basic | Limited | No | Issue detection |
| Pingdom | Partial | Basic | 7 | No | Quick checks |

How to Read a Waterfall Chart (And Find What’s Slowing You Down)
A waterfall chart is the single most useful output from any speed test. It shows every resource your page loads — HTML, CSS, JavaScript, images, fonts — in chronological order with timing bars. Here’s what to look for:
- Long green bars (TTFB): Your server is slow to respond. Consider upgrading hosting or adding caching.
- Render-blocking resources: CSS and JS files that load before any content appears. Defer or inline critical CSS.
- Large image files: Images over 200KB should be compressed. Use WebP format for 30-50% smaller files.
- Third-party scripts: Analytics, chat widgets, and social embeds that load from external servers. Each adds latency.
- Long chains: Resources that depend on other resources (CSS loads font, which loads another font). Flatten these chains.
GTmetrix and WebPageTest produce the best waterfall charts. Spend 5 minutes reading your waterfall and you’ll understand exactly why your site is slow. Additionally, this knowledge helps you prioritize fixes — tackle the biggest bottleneck first for the most impact.
Quick Wins: Speed Fixes That Cost Nothing
Most speed problems have free solutions. Here are the fixes that deliver the biggest improvements with the least effort:
- Compress images: Use Squoosh.app (free, browser-based) to convert images to WebP format. This typically reduces file size by 30-50%. ($0)
- Enable lazy loading: Add
loading="lazy"to images below the fold. WordPress does this automatically since version 5.5. ($0) - Minimize CSS and JavaScript: Remove unused code with free tools like PurgeCSS. Many WordPress caching plugins do this automatically. ($0)
- Enable browser caching: Add cache headers so returning visitors load faster. Most hosting providers support this via .htaccess or Nginx config. ($0)
- Use a free CDN: Cloudflare’s free plan caches your static assets on their global network, reducing load times worldwide. ($0)
- Defer non-critical JavaScript: Add
deferorasyncattributes to script tags that don’t need to run immediately. ($0)
These six fixes can improve load time by 2-5 seconds on most sites. Furthermore, none of them require a paid tool or service. Start with image compression — it’s the single biggest win for most websites.
Monthly Speed Audit Workflow: 15 Minutes for Faster Sites
Speed isn’t a one-time fix. New content, plugin updates, and theme changes can introduce slowdowns. Here’s a monthly workflow that takes about 15 minutes:
- Test your homepage with PageSpeed Insights. Note your Core Web Vitals scores.
- Test your top 3 pages (highest traffic from your analytics report).
- Run GTmetrix on any page scoring below 90 to get a waterfall analysis.
- Fix the biggest issue identified. Just one fix per month keeps your site fast without overwhelming you.
- Log your scores in a simple spreadsheet to track trends over time.
Consistency beats intensity. A 15-minute monthly audit catches problems before they accumulate. Additionally, tracking your scores over time helps you spot when a plugin update or content change introduced a slowdown — so you can revert the change quickly.
Frequently Asked Questions
What’s a good speed score?
On PageSpeed Insights, aim for 90+ on desktop and 70+ on mobile. Mobile scores are almost always lower because the test simulates a mid-range phone on a 4G connection. A score of 50-89 is “needs improvement” and below 50 is “poor.” However, don’t chase a perfect 100 — the difference between 90 and 100 rarely matters for real users. Focus on Core Web Vitals being green (passing) rather than the overall score number.
Does speed affect SEO?
Yes. Google confirmed Core Web Vitals as a ranking factor in 2021. Sites that pass all three Core Web Vitals get a small ranking boost. More importantly, slow sites have higher bounce rates, which indirectly hurts SEO through reduced engagement signals. Furthermore, Google crawls slow sites less efficiently, meaning your new content gets indexed slower. Speed won’t make a terrible page rank #1, but it can be the tiebreaker between similar pages. For more on tracking your SEO performance, see our free rank tracking tools guide.
Which tool is most accurate?
PageSpeed Insights field data is the most accurate because it uses real Chrome user measurements. Lab tests (all tools) simulate conditions that may not match your actual visitors. Therefore, use lab tests for diagnostics and field data for benchmarking. If you can only use one tool, use PageSpeed Insights — its field data reflects what Google uses for ranking decisions.
Your Free Speed Optimization Checklist
Stop guessing why your site is slow. Here’s your action plan:
- Run PageSpeed Insights on your homepage right now. Note your Core Web Vitals scores. ($0)
- Run GTmetrix to get a waterfall chart and identify the biggest bottleneck. ($0)
- Compress your images with Squoosh.app — this is almost always the biggest win. ($0)
- Enable Cloudflare free CDN if you haven’t already — global caching for zero cost. ($0)
- Set up a monthly audit testing your homepage and top 3 pages in PageSpeed Insights. ($0)
Total cost: $0/month. Every free website speed test tool on this list gives you professional-grade diagnostics. The paid versions mostly add automated monitoring and historical tracking — nice to have, but not necessary. Your site’s speed problems are hiding in plain sight, and these free tools will find every single one of them.