I once watched a client pay $200/month for a reporting dashboard tool when everything they needed was sitting right inside Google — for free. If you’ve been putting off building proper analytics reports because tools like Tableau or Power BI feel expensive and overwhelming, this Looker Studio tutorial for beginners is your shortcut. It’s completely free, surprisingly powerful, and you’ll have your first professional dashboard running in about 15 minutes.
Looker Studio (formerly Google Data Studio) is Google’s free data visualization and reporting tool. It connects to over 1,050 data sources, turns raw numbers into interactive charts, and lets you share polished reports with anyone — all without spending a dime. Let’s build your first dashboard step by step.

What Is Looker Studio? (And What Does It Cost?)
Looker Studio is a cloud-based tool that transforms your data into customizable, interactive dashboards and reports. You sign in with any Google account — personal or business — and start building immediately. No download, no installation, no trial period.
Here’s the pricing situation:
| Version | Price | What You Get |
|---|---|---|
| Looker Studio | $0/month forever | Unlimited reports, dashboards, viewers, data sources |
| Looker Studio Pro | $9/user/month | Team workspaces, admin controls, SLA support |
The free version has no report limits, no viewer limits, and no data source restrictions. Most small businesses will never need Pro. Seriously — save that $9.
What You Need to Get Started (All Free)
- A Google account — any Gmail or Google Workspace account works.
- A data source — the easiest starting point is Google Sheets or Google Search Console. But you can also upload CSV files or connect to databases.
- 15 minutes — that’s genuinely all it takes to build your first report.
Total cost: $0. Not a free trial. Not freemium with limits. Actually free.
Looker Studio Tutorial for Beginners: Your First Dashboard
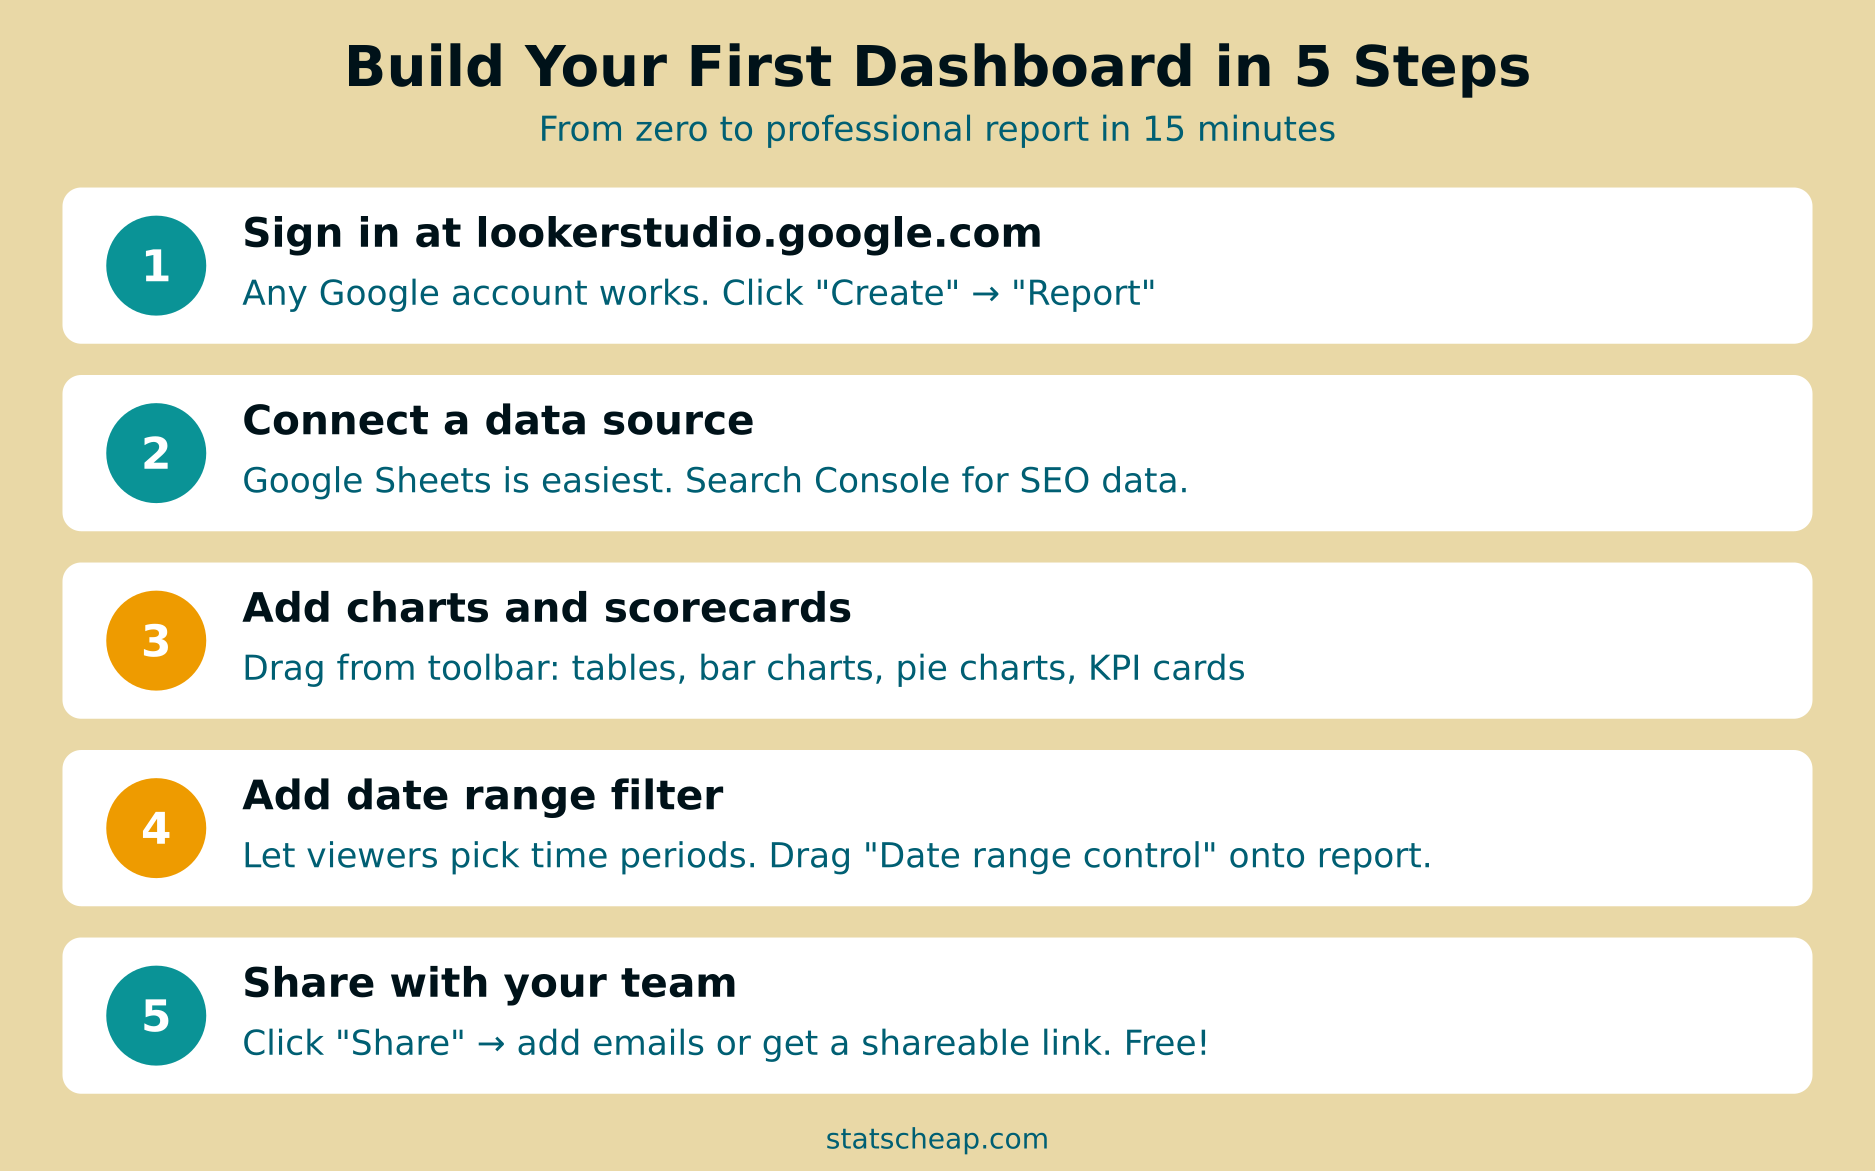
Follow these five steps and you’ll have a working, shareable dashboard by the end. No prior experience needed.
Step 1: Sign In and Create a New Report
Go to lookerstudio.google.com and sign in with your Google account. On the home screen, click the “Create” button in the top-left corner, then select “Report.” You’ll see a blank canvas — this is your dashboard.
Alternatively, start with a template. Click “Template Gallery” on the home screen to browse dozens of pre-built layouts. There are templates for Search Console, YouTube, Google Ads, and general marketing reports. Templates save time, but building from scratch teaches you more.
Step 2: Connect Your Data Source
Immediately after creating a report, Looker Studio asks you to add a data source. This is where your numbers come from. For beginners, I recommend starting with one of these:
- Google Sheets — perfect for any business data you already track in spreadsheets. Sales numbers, leads, expenses, inventory — anything in a spreadsheet can become a dashboard.
- Google Search Console — shows your website’s SEO performance. Queries, clicks, impressions, average position — all visualized without spreadsheets.
- CSV file upload — if your data lives in Excel or another tool, export it as CSV and upload directly.
To connect, search for your data source type in the connector panel, authorize access, and select the specific sheet, property, or file. Looker Studio automatically detects your columns and data types.
Step 3: Add Charts, Tables, and Scorecards
Now the fun part. Use the toolbar at the top to add visual elements to your report:
- Scorecards — big single numbers. Perfect for KPIs like total revenue, visitor count, or conversion rate.
- Time series — line charts showing trends over time. Great for traffic, sales, or any metric you want to track week-over-week.
- Bar charts — compare categories. Which product sells most? Which traffic source performs best?
- Pie charts — show proportions. Use sparingly — bar charts are usually clearer.
- Tables — detailed data with sorting. Good for showing top pages, top keywords, or itemized data.
- Geo maps — plot data by location. Where are your customers?
Click any chart type, then drag it onto the canvas. Looker Studio automatically fills it with data from your connected source. You can customize dimensions (what you’re grouping by) and metrics (what you’re measuring) in the right-side panel.

Step 4: Add Filters and Date Range Controls
Interactive controls turn a static report into a dynamic dashboard. The two most important controls are:
- Date range control — lets viewers pick any time period. Last 7 days, last month, custom range. Drag it from the toolbar onto your report.
- Filter controls — dropdown menus that filter all charts at once. For instance, a “Country” filter lets viewers see data for just one region. Add it from “Add a control” → “Drop-down list.”
These controls work across all charts on the page. Change the date range, and every chart updates instantly. This is what makes Looker Studio dashboards feel professional — and it’s completely free.
Step 5: Style, Brand, and Share
Make your dashboard look like it belongs to your brand:
- Theme — click “Theme and Layout” in the toolbar. Pick a color scheme or set custom brand colors.
- Logo — drag and drop your company logo onto the report using the “Image” tool.
- Fonts — change heading and body fonts in the theme editor.
- Layout — resize the canvas, adjust grid spacing, and snap elements to alignment guides.
When it looks good, click “Share” in the top-right corner. You can:
- Invite people by email — they’ll need a Google account to view.
- Get a shareable link — anyone with the link can view (or edit, if you allow it).
- Schedule email delivery — automatically send PDF snapshots on a schedule.
- Embed — put the live dashboard on your website or intranet.
Free Data Sources That Work With Looker Studio
One of Looker Studio’s biggest strengths is its connector ecosystem. Google’s own connectors are free and cover the most popular data sources. On top of that, there are over 1,050 community-built connectors for third-party tools.
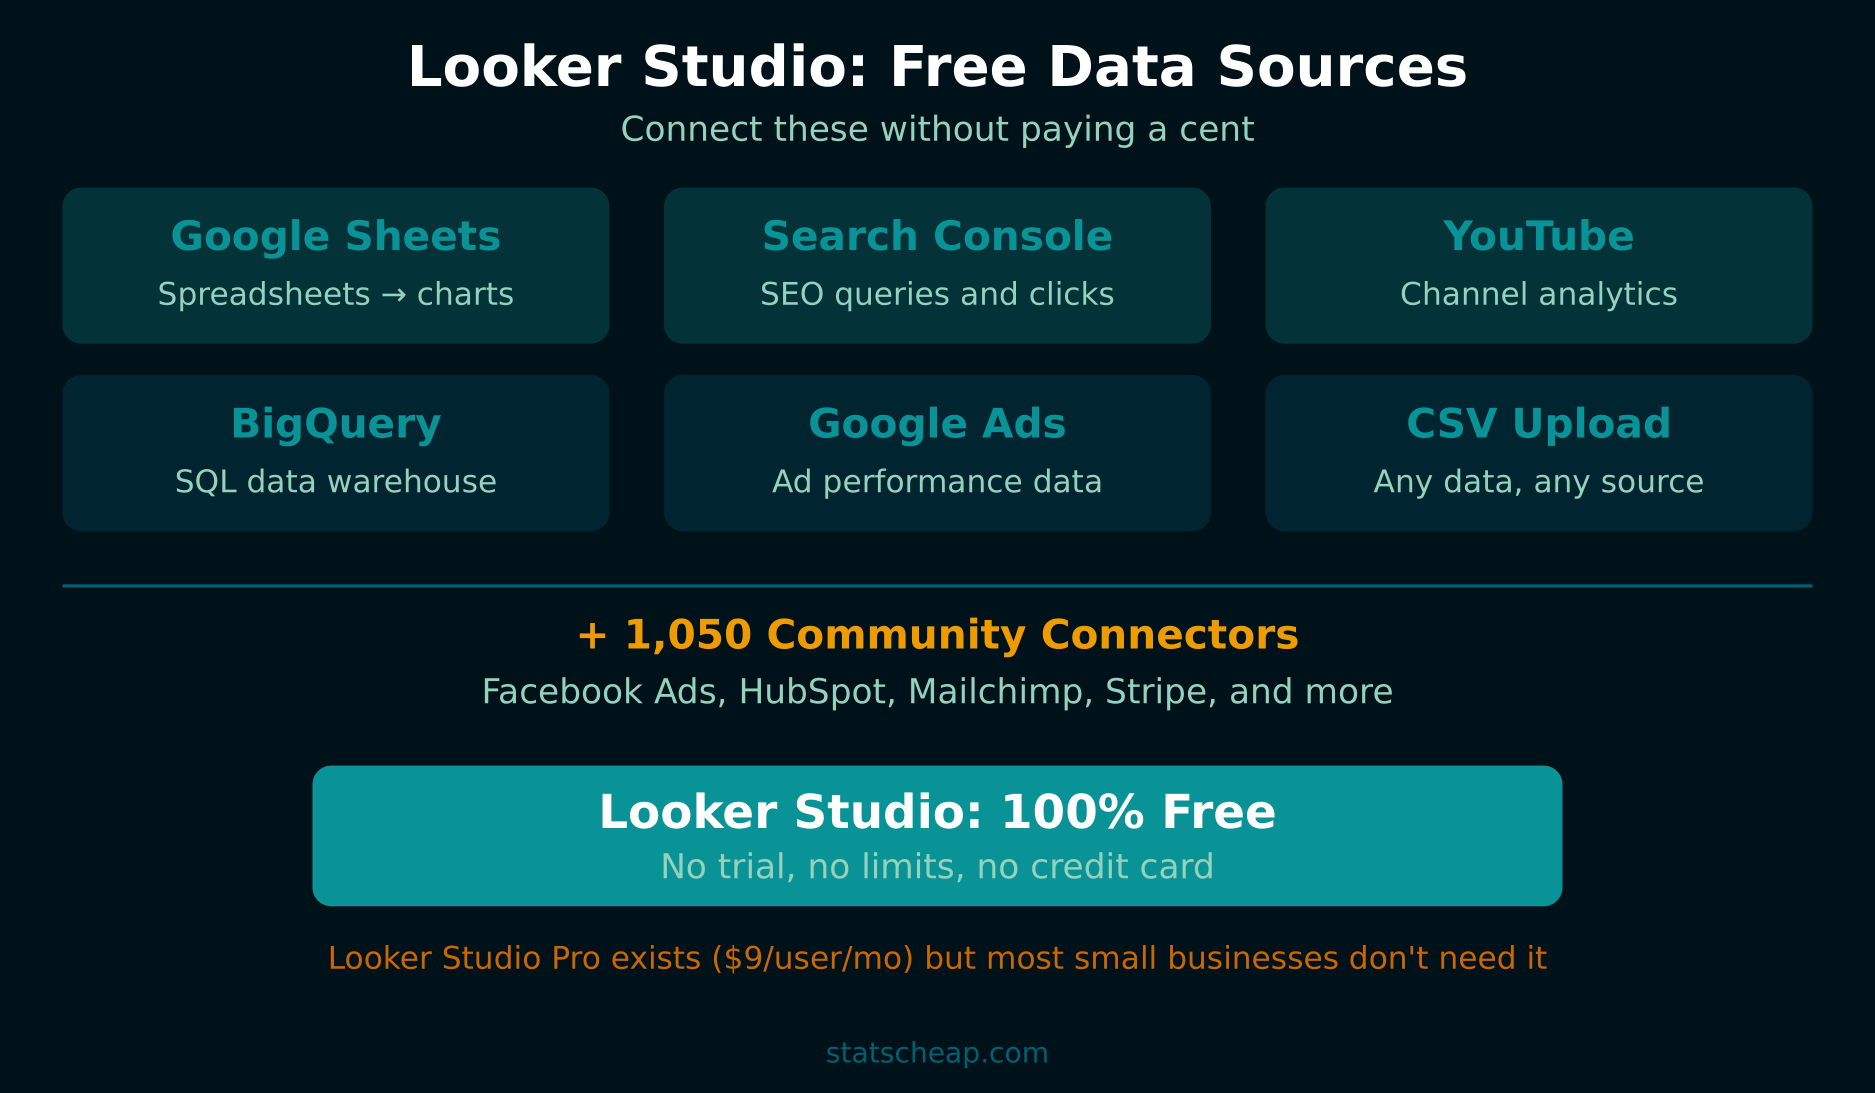
The native Google connectors are completely free: Google Sheets, Search Console, YouTube Analytics, Google Ads, BigQuery, and CSV upload. Community connectors for tools like Facebook Ads, HubSpot, Mailchimp, and Stripe may have their own pricing — some are free, some charge a monthly fee. Always check before connecting.
For most small businesses, the free Google connectors are more than enough. If you’re tracking UTM parameters on your campaigns, that data flows into your analytics platform and then straight into Looker Studio — no extra cost.
3 Dashboard Ideas for Small Businesses
Not sure what to build first? Here are three practical dashboards that every small business can benefit from:
1. Weekly Website Performance Report
Data source: Google Search Console
Key metrics: Total clicks, impressions, average CTR, average position
Charts: Time series for clicks over time, table of top 10 queries, bar chart of top pages
Time: 10 minutes to build
This replaces the manual process of logging into Search Console every week. Once built, it updates automatically. Share it with your team or clients — they’ll think you paid for a fancy reporting tool.
2. Sales and Revenue Tracker
Data source: Google Sheets (log sales manually or export from your POS/e-commerce platform)
Key metrics: Total revenue, number of orders, average order value, revenue by product
Charts: Scorecard for total revenue, bar chart by product category, time series for daily sales
Time: 15 minutes to build
3. Marketing Campaign Dashboard
Data source: Google Sheets with UTM-tagged campaign data (or Google Ads directly)
Key metrics: Clicks by source, conversions by campaign, cost per click, ROI by channel
Charts: Stacked bar chart by channel, table of campaigns sorted by conversions
Time: 20 minutes to build
For tracking campaigns properly, make sure you’re using UTM parameters on every external link. The data will flow automatically into your analytics and then into Looker Studio.
Looker Studio Tips for Beginners
After building dozens of dashboards for clients on zero budget, here are the tips I wish I’d known from day one:
- Start with templates. Don’t build from scratch until you’ve seen what’s possible. The template gallery is a goldmine of ideas and layouts. Free.
- One data source per page. If you’re pulling from multiple sources (Search Console + Sheets), put them on separate pages. This avoids confusion with blended data.
- Use scorecards for KPIs. Big numbers at the top of the report give instant context. Total visitors, total revenue, conversion rate — make them prominent.
- Always add a date range control. Without it, viewers can’t explore different time periods. It takes 10 seconds to add and makes your report 10x more useful.
- Name your charts. Click on a chart, go to “Style,” and add a clear title. “Monthly Revenue by Product” is better than an unlabeled bar chart.
- Duplicate instead of rebuilding. Made a great report? Click the three dots → “Make a copy” to reuse the layout with different data.
- Check mobile view. Click “View” → “Fit to width” to see how your dashboard looks on smaller screens. Many stakeholders check reports on their phone.
Looker Studio vs Paid Alternatives
How does a free tool compare to the paid competition? Let’s do the math:
| Tool | Price | Best For |
|---|---|---|
| Looker Studio | $0/month | Small-to-mid businesses, Google ecosystem users |
| Tableau | $75/user/month | Enterprise analytics, complex data modeling |
| Power BI Pro | $10/user/month | Microsoft ecosystem, corporate environments |
| Databox | $59/month | Agency reporting, multi-client dashboards |
| Geckoboard | $49/month | TV dashboards, real-time KPIs |
For the vast majority of small businesses, Looker Studio does everything you need. You’d have to spend $75/month on Tableau to get features that most small teams never use. Budget-friendly doesn’t mean second-rate — in this case, free genuinely wins.
If you want to pair your dashboards with free analytics tools underneath, check out our complete guide to free web analytics tools or learn how to build a full analytics stack for $0.
Frequently Asked Questions
Is Looker Studio really free?
Yes. Looker Studio is 100% free with no time limit, no report cap, and no viewer restrictions. Google offers a paid “Pro” tier for $9/user/month that adds team management features, but the core product is free forever. There’s no catch.
Can I use Looker Studio without Google Analytics?
Absolutely. Looker Studio connects to over 1,050 data sources — Google Sheets, CSV files, SQL databases, Facebook Ads, Mailchimp, and many more. You don’t need Google Analytics at all. Many of my clients use it purely with spreadsheet data.
How long does it take to learn Looker Studio?
You can build a basic dashboard in 15 minutes with no prior experience. After a few hours of practice, you’ll be comfortable with custom calculations, blended data, and multi-page reports. The learning curve is gentle compared to Tableau or Power BI.
Can I schedule automatic report emails?
Yes. Click “Share” → “Schedule email delivery” and choose daily, weekly, or monthly. Looker Studio sends a PDF snapshot to the recipients you specify. Completely free — no paid add-ons needed.
Bottom Line: The Best Free Dashboard Tool for Small Business
Looker Studio is, hands down, the best free reporting tool available. It connects to virtually any data source, produces professional-looking dashboards, and costs nothing. Here’s your action plan:
- Sign up at lookerstudio.google.com — takes 30 seconds.
- Connect Google Sheets or Search Console as your first data source.
- Build a simple dashboard with 3-4 charts and a date range filter.
- Share it with your team or clients — they’ll be impressed.
- Iterate — add more data sources and pages as you grow.
Stop paying for dashboards. Stop emailing spreadsheets. Looker Studio gives you everything you need — and the price is exactly right: $0.