If you’ve ever opened Google Analytics, seen the words “sessions,” “engagement rate,” and “referral source” all in one row, and quietly closed the tab — this analytics glossary is for you. No jargon. No fluff. Just plain-English definitions of the web analytics terms a small business actually runs into, each one explained with a real example and a note on where to see it for free. Think of it as the missing dictionary that should have shipped with every web analytics tool.
I’ve set up analytics for hundreds of small business sites, and the same thing happens every time. The tools aren’t the problem. The vocabulary is. Owners pay for web analytics dashboards full of metrics they were never taught to read, then feel dumb for not using them. You’re not dumb. Nobody handed you the dictionary. So here it is — built for budget-conscious owners, not enterprise teams with a data department.
Here’s how to use it. Each entry gives you a one-sentence definition, the formula where there is one, a small business example with real numbers, my honest take on whether the metric is worth your attention, and where you can see it for $0. Skim the index, jump to whatever’s confusing you, and get back to running your business.
Analytics Metrics Every Small Business Should Know
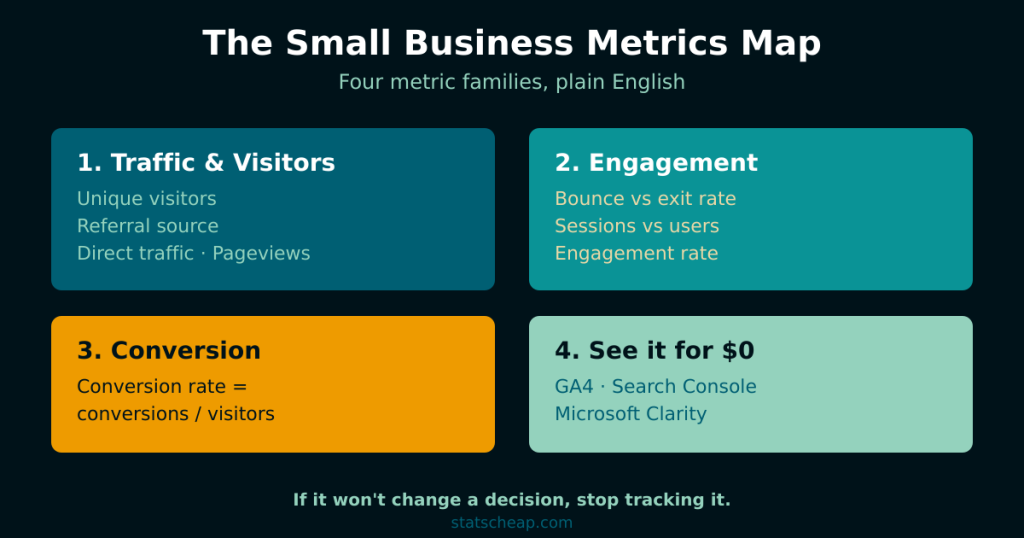
Before the definitions, one piece of advice that will save you hours: you don’t need to understand every metric in your dashboard. You need to understand maybe a dozen. The rest is noise you can safely ignore. This glossary groups the ones that matter into four families.
- Traffic & visitor metrics — who shows up and where they came from: unique visitors, referral source, direct traffic, pageviews.
- Engagement metrics — what people do once they arrive: bounce rate vs exit rate, sessions vs users, engagement rate.
- Conversion metrics — whether visits turn into business: conversion rate.
- Where to see it all for free — the no-cost tools that show you every metric above.
Two quick ground rules. First, every definition below is tool-agnostic, but most of these terms come straight from Google Analytics, so I’ll note where GA4 names things differently from the old version. Second, “free” here means genuinely free forever — not a 14-day trial. Let’s get into it.
Traffic & Visitor Metrics
Unique Visitors
Unique visitors is the count of distinct people who came to your site over a period, no matter how many times each one visited. If one person stops by your site five times in a week, that’s five visits but one unique visitor.
The metric matters because it answers “how many actual humans am I reaching?” — a different question from “how busy was my site?” A small spike in visits from one obsessed customer refreshing your page looks like growth until you check the unique count and see it was one person. In GA4, the closest term is Total Users (or Active Users); the old Universal Analytics called it “Users.” Tools count uniqueness with cookies or device fingerprints, so the number is an estimate, not a headcount — close enough to trust, not precise enough to obsess over.
Small business example: A handmade-soap shop saw 1,200 visits last month but only 760 unique visitors. That ratio (about 1.6 visits per person) told the owner people were coming back to browse before buying — a healthy sign for a considered purchase.
The budget take: Unique visitors is one of the few “size” numbers worth watching, because it’s the denominator for almost everything else — conversion rate, cost per visitor, you name it. You don’t need a paid tool to track it. Where to see it for $0: GA4 (Reports → Acquisition) shows Total Users right on the overview.
Referral Source
A referral source is the website that sent a visitor to you by linking to your site — when someone clicks a link on another site and lands on yours, that other site is the referral source.
This is the metric that tells you which of your off-site efforts actually work. Guest post on a niche blog? A directory listing? A mention in someone’s newsletter? Referral data shows you which links send real people, not just which ones exist. Note the distinction: referral traffic specifically means clicks from links on other websites. Visitors from Google search are counted as organic search, and visitors from Facebook or Instagram are usually bucketed as social — not referral — in Google Analytics.
Small business example: A local bakery got 90 referral visits in a month. Digging in, 70 came from a single neighborhood food blogger’s post. That one relationship was worth more than the bakery’s entire paid-ad experiment — so the owner doubled down on local bloggers instead of ads.
The budget take: Referral source is pure gold for a small business, because it points you toward free and cheap growth channels you can repeat. Where to see it for $0: GA4 → Reports → Acquisition → Traffic acquisition, then look at the “Referral” channel. It costs nothing and it’s the first report I check for any new client.
Direct Traffic
Direct traffic is everyone who arrived at your site without a trackable referrer — they typed your URL straight into the browser, used a bookmark, or clicked a link your analytics couldn’t tag.
Here’s the part nobody tells you: direct traffic is also the “I don’t know” bucket. When a visit can’t be attributed to search, social, or a referral, analytics tools dump it into direct. So a chunk of your “direct” visitors actually came from links in emails, PDFs, or apps that stripped the source. A rising direct number can mean loyal repeat customers — or it can mean broken campaign tracking. The fix for the second one is simple: tag every link you control with UTM parameters so it stops landing in the dark.
Small business example: A consultant noticed 40% of her traffic was “direct.” That seemed high for a brand nobody Googles yet. The culprit: her email newsletter links had no tags, so every newsletter click counted as direct. After tagging, half of that “direct” traffic correctly reclassified as email.
The budget take: Don’t celebrate a big direct number until you’ve ruled out untagged links. Where to see it for $0: GA4 → Traffic acquisition shows “Direct” as a channel — free, and worth auditing the moment it climbs above 20-30%.
Pageviews vs Sessions
A pageview is one load of one page. A session is one visit, which can include many pageviews. So pageviews always equal or exceed sessions — never the other way around.
The relationship between the two is itself a useful signal. Divide pageviews by sessions and you get pages per session — roughly how deep people go before they leave. A blog with lots of internal links should see two or three pages per session; a one-page landing site will sit near one. In GA4, “pageviews” became “Views” and the metric you’ll see most is Views per active user, but the idea is identical. Don’t confuse a high pageview count with success — it could mean engaged readers, or it could mean confused visitors clicking around trying to find what they need.
Small business example: A recipe blog logged 8,000 pageviews across 3,200 sessions last month — about 2.5 pages per session. The owner used that to argue (correctly) that her internal “related recipes” links were working and worth keeping.
The budget take: Sessions tell you how often people visit; pageviews tell you how much they look at. Watch both, but make decisions on sessions and conversions. Where to see it for $0: Both live in GA4’s Engagement reports at no cost.
Engagement Metrics
Bounce Rate vs Exit Rate
Bounce rate is the percentage of visits where someone landed on a page and left without doing anything else. Exit rate is the percentage of people who left your site from a specific page, regardless of how they got there. Same idea — leaving — but measured from different starting points.
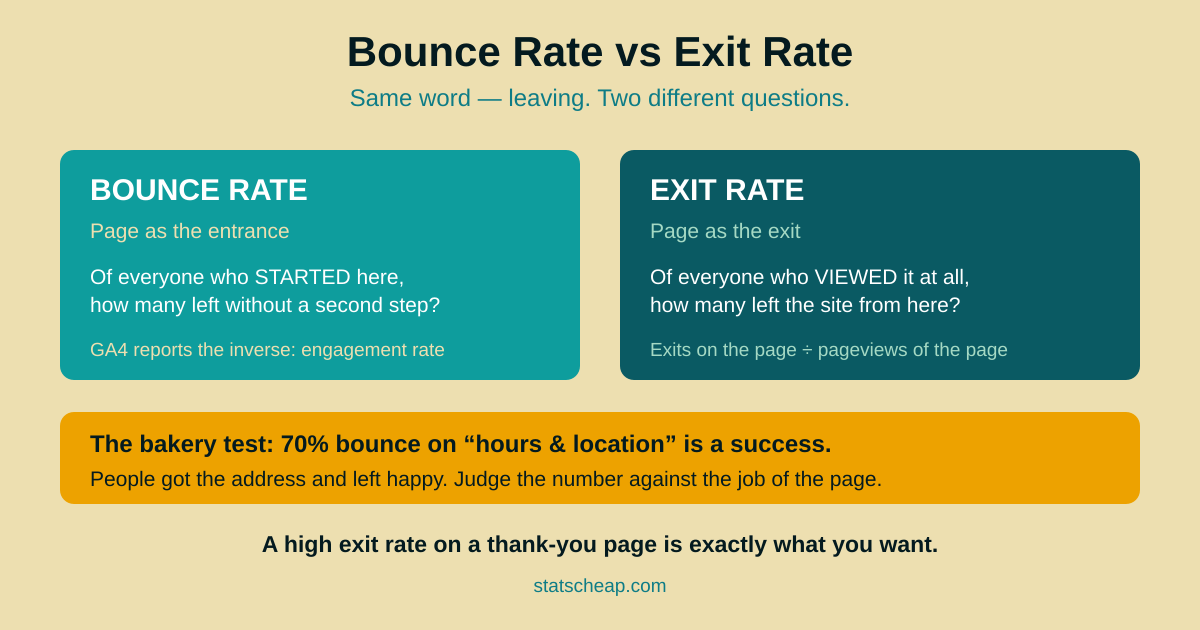
The distinction trips up everyone, so here’s the clean version. Bounce rate is page-as-entrance: of everyone who started on this page, how many left immediately? Exit rate is page-as-exit: of everyone who viewed this page at any point, how many left from here? A checkout “thank you” page should have a high exit rate — people leave happy after buying. The formula for exit rate is exits on a page divided by total pageviews of that page. Bounce rate sounds scary. It isn’t — and you don’t need a paid tool to track it. Here’s the free version, and the context to read it right.
Small business example: On a 2,000-visit-per-month bakery site, a 70% bounce rate was actually fine — because most visitors landed on the “hours and location” page, got the address, and left satisfied. A high bounce on an info page is success, not failure. Context decides.
The budget take: Never judge bounce rate in isolation; judge it against what the page is supposed to do. Where to see it for $0: GA4 reports an Engagement rate (the inverse idea) by default, and you can add Bounce rate as a column. For the why behind a bounce, watch session recordings free in Microsoft Clarity — it shows you exactly where people gave up.
Sessions vs Users
A user is one person. A session is one visit by that person. One user can start many sessions — which is exactly why these two numbers are different and why mixing them up leads to bad decisions.
Think of a user as a customer and a session as a trip to your store. One loyal customer might visit ten times this month: that’s one user, ten sessions. In GA4, a session ends after 30 minutes of inactivity by default, then a new visit by the same person counts as a fresh session under the same user. The practical lesson: report revenue and conversions per user when you care about people, and per session when you care about visit quality. Quote “users” to brag about reach; quote “sessions” to measure how hard people are working to engage.
Small business example: A subscription box site had 500 users but 1,400 sessions in a month — nearly three visits per person. That stickiness predicted strong renewals, and it did: the owner stopped worrying about traffic volume and focused on the loyal core.
The budget take: Don’t double-count. If you report “1,400 visitors” when you mean 1,400 sessions, you’ll overestimate your audience and your ad math will be off. Where to see it for $0: GA4’s overview shows Users and Sessions side by side at no cost.
Engagement Rate
Engagement rate is the percentage of visits that were “engaged” — meaning the visitor stayed longer than 10 seconds, viewed more than one page, or completed a conversion. It’s GA4‘s headline replacement for the old bounce rate, flipped to count the good visits instead of the bad ones.
The math is friendly: engaged sessions divided by total sessions. If 100 people visit and 55 of them stay, scroll, or click, your engagement rate is 55%. Because GA4 defines an “engaged session” generously (10 seconds clears the bar), engagement rate tends to look healthier than the old bounce rate looked grim — same behavior, sunnier framing. Read it as a quality gauge: rising engagement on a landing page usually means your headline and offer are matching what people expected when they clicked.
Small business example: A coaching site’s pricing page sat at a 38% engagement rate. After the owner moved the testimonials above the fold, it climbed to 61% over the next month — fewer instant leavers, more people reading on. No paid tool, no redesign budget, just one layout tweak validated by a free metric.
The budget take: Engagement rate is the single most useful “are people interested?” number GA4 gives you for free. Track it per landing page, not site-wide, so you know which pages earn attention. Where to see it for $0: It’s a default column in every GA4 Engagement and Acquisition report.
Conversion Metrics
Conversion Rate
Conversion rate is the percentage of visitors who did the thing you wanted them to do — buy, sign up, book, call — out of everyone who had the chance. It’s the metric that ties your traffic to your business.
The formula is dead simple: conversions divided by visitors (or sessions), times 100. Twenty sales from 1,000 visitors is a 2% conversion rate. The catch is defining “conversion” honestly — for an online store it’s a purchase, for a service business it might be a contact-form submission or a booked call. Pick the action that actually moves money, not a vanity click. A common small-business benchmark for e-commerce sits around 2-3%, but yours depends entirely on your traffic quality and your offer, so treat any benchmark as a loose guide, not a verdict. For the full how-to of setting conversions up on a store, see our guide to free e-commerce analytics — this entry is just the definition.
Small business example: A florist’s site converted at 1.1%. Instead of buying more traffic, the owner added a phone number to the header and a “same-day delivery” badge. Conversion rate rose to 2.4% — meaning the same traffic suddenly produced more than double the orders, for free.
The budget take: Improving conversion rate is almost always cheaper than buying more traffic, and it’s where budget-conscious owners get the biggest returns. Where to see it for $0: Set up a free conversion event in GA4 (Admin → Events → mark as key event), then watch the conversion rate populate automatically.
Where to See These Metrics for Free
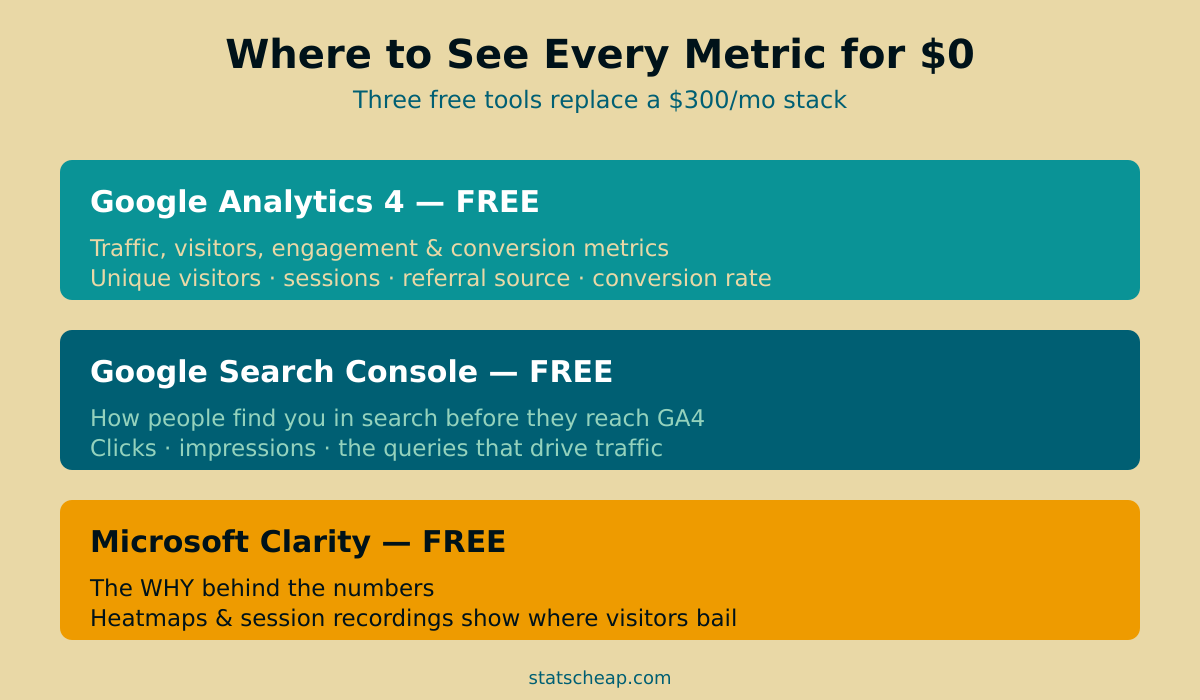
You don’t need to spend a dime to track everything in this glossary. Three free tools cover the lot, and together they’re the backbone of a budget web analytics setup.
- Google Analytics 4 (GA4) — free: Your home for traffic, visitor, engagement, and conversion metrics. Unique visitors, sessions, referral source, direct traffic, engagement rate, conversion rate — all of it lives here at no cost.
- Google Search Console — free: Shows how people find you in Google search before they ever hit GA4 — clicks, impressions, and the queries that bring traffic. Pair it with GA4 to see the full journey.
- Microsoft Clarity — free: The why behind the numbers. Heatmaps and session recordings show you where visitors hesitate, rage-click, or bail — the context GA4’s charts can’t give you.
That’s a complete metrics toolkit for $0/month. If you want the step-by-step setup, we’ve written the full walkthrough on how to build a free analytics stack with exactly these three tools. And if you’re still weighing whether you’ll ever need to pay, our free vs paid analytics decision framework lays out the honest trade-offs.
One last thing. Knowing the definitions is step one; knowing which metrics deserve your limited attention is step two. We cover that in the companion guide to the 8 KPIs that matter for small businesses — definitions here, priorities there. Read both and you’ll never feel lost in a dashboard again.
Frequently Asked Questions
What analytics metrics should a small business actually track?
Start with four: unique visitors (reach), referral source (which channels work), conversion rate (whether visits make money), and engagement rate (whether people care). Those four answer the questions that change what you do next week. Everything else in this analytics glossary is supporting detail — useful when you’re digging into a specific problem, but not worth daily attention. If a metric wouldn’t change a decision, stop tracking it.
What is the difference between a session and a user?
A user is one person; a session is one visit. One user can create many sessions — a loyal customer who visits eight times this month is one user and eight sessions. Report per user when you care about how many people you reach, and per session when you care about visit quality. Mixing them up is the most common reason small business owners overestimate their audience size.
What is a good bounce rate for a small website?
There’s no universal “good” number, because it depends on what the page is for. An info page like hours-and-location can have a 70% bounce rate and still be doing its job perfectly — people got what they came for and left. A product or pricing page with a high bounce rate is more worrying. Judge bounce rate against the page’s purpose, never against a one-size-fits-all benchmark.
Where can I see these metrics for free?
Three free tools cover everything in this glossary: Google Analytics 4 for traffic, engagement, and conversion metrics; Google Search Console for how people find you in search; and Microsoft Clarity for heatmaps and session recordings that explain the why. All three are genuinely free forever, not trials, and together they replace analytics suites that cost hundreds of dollars a month.
The Bottom Line
You don’t need a data science degree or an enterprise budget to read your own web analytics — you just needed someone to translate the vocabulary into plain English. Bookmark this glossary, come back whenever a metric trips you up, and remember the rule that beats every expensive dashboard: if a number wouldn’t change what you do next, don’t waste your attention on it. Smart beats expensive, and understanding your metrics is the smartest free upgrade you can give your business.